We share the article on How much of the world’s fish are managed sustainably or overfished? from the fishing and overweight report published by OurWorldData.
Sustainable fishing, according to its fishing definition, is catching the right amount. If you fish too much, fish populations decline. If you fish too little, you are giving up valuable food resources and income. We take a closer look at the different concepts of sustainable fishing and how this “sweet spot”, the maximum sustainable yield, is defined.
How much of the world’s fish is caught sustainably?
This is often measured in terms of fish populations. A fish population is a subpopulation of a particular species of fish with common parameters such as location, growth, and mortality. Often it is a species of fish in a certain place. Indian Ocean tuna, for example. Importantly, this metric treats each fish population as if it were the same, regardless of the size of each population. A stock in which we catch 1000 tons is counted the same as a stock in which we catch 10 tons.
When defining the sustainability of fisheries we need to know three terms:
Overexploited or overfished: This is sometimes referred to as “overexploited.” These are populations of fish where we catch fish faster than these populations can reproduce. As a result, populations decline and stocks are depleted to levels below the most productive level. This is unsustainable.
Maximally Sustainably Fished – This has sometimes been referred to as “fully fished” or “fully exploited” in the past. Some may interpret these terms negatively, but in reality, this is the “sweet spot” that fisheries are aiming for. This is maximum sustainable yield, where we catch as many fish as possible without reducing fish stocks below the most productive level.
Underfish: This is when the catch of fish is less than the reproductive rate of the fish stocks. We could catch more fish without declining fish stocks. From a resource standpoint, this is not optimal because we are missing out on a key source of food and income for fishing communities.
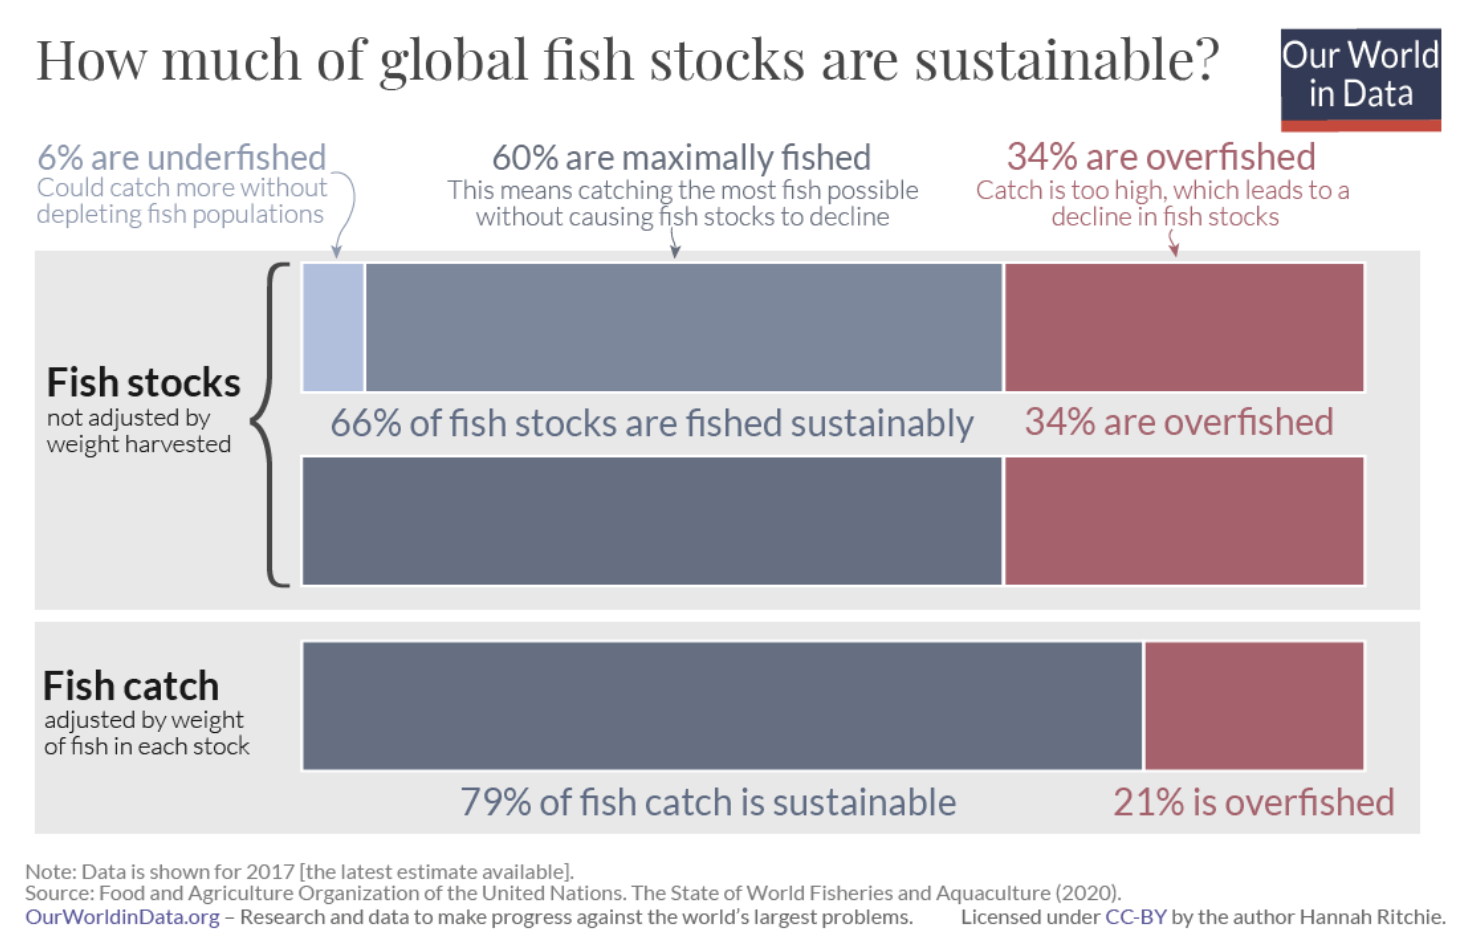
Note: Data are from 2017 (latest estimates available) Source: Food and Agriculture Organization of the United Nations. The State of the World Fisheries and Aquaculture (2020) OurWorldData.org – Research and data to make progress against the worlds largest problems Licensed under CC By the author Hanna RitchieThe breakdown of these three categories is shown in the chart. Combined, under-exploited, and max-exploited would be considered sustainable because fish stocks are not declining.
One-third (34%) of global fish stocks were overexploited in 2017. Two-thirds were biologically sustainable, with 60% being overfished and 6% being underexploited.
But this does not tell us how much fish was sustainably sourced. This is because fish populations can be very different size. Let’s say we have two populations of fish. Stock A is sustainable and we catch 80 tons of fish per year. Stock B is unsustainable and we are catching 20 tons of it. If we add them up, we would conclude that only half of our fish stocks are sustainable, but 80% of our catches are.
When we adjust for different amounts of catch from each stock, we find that almost four-fifths (79%) of the fish catch is sustainably sourced. 21% of the catch comes from overexploited populations.
Overall, two-thirds of the fisheries are sustainable and provide four-fifths of our seafood.
How is overfishing changing over time?
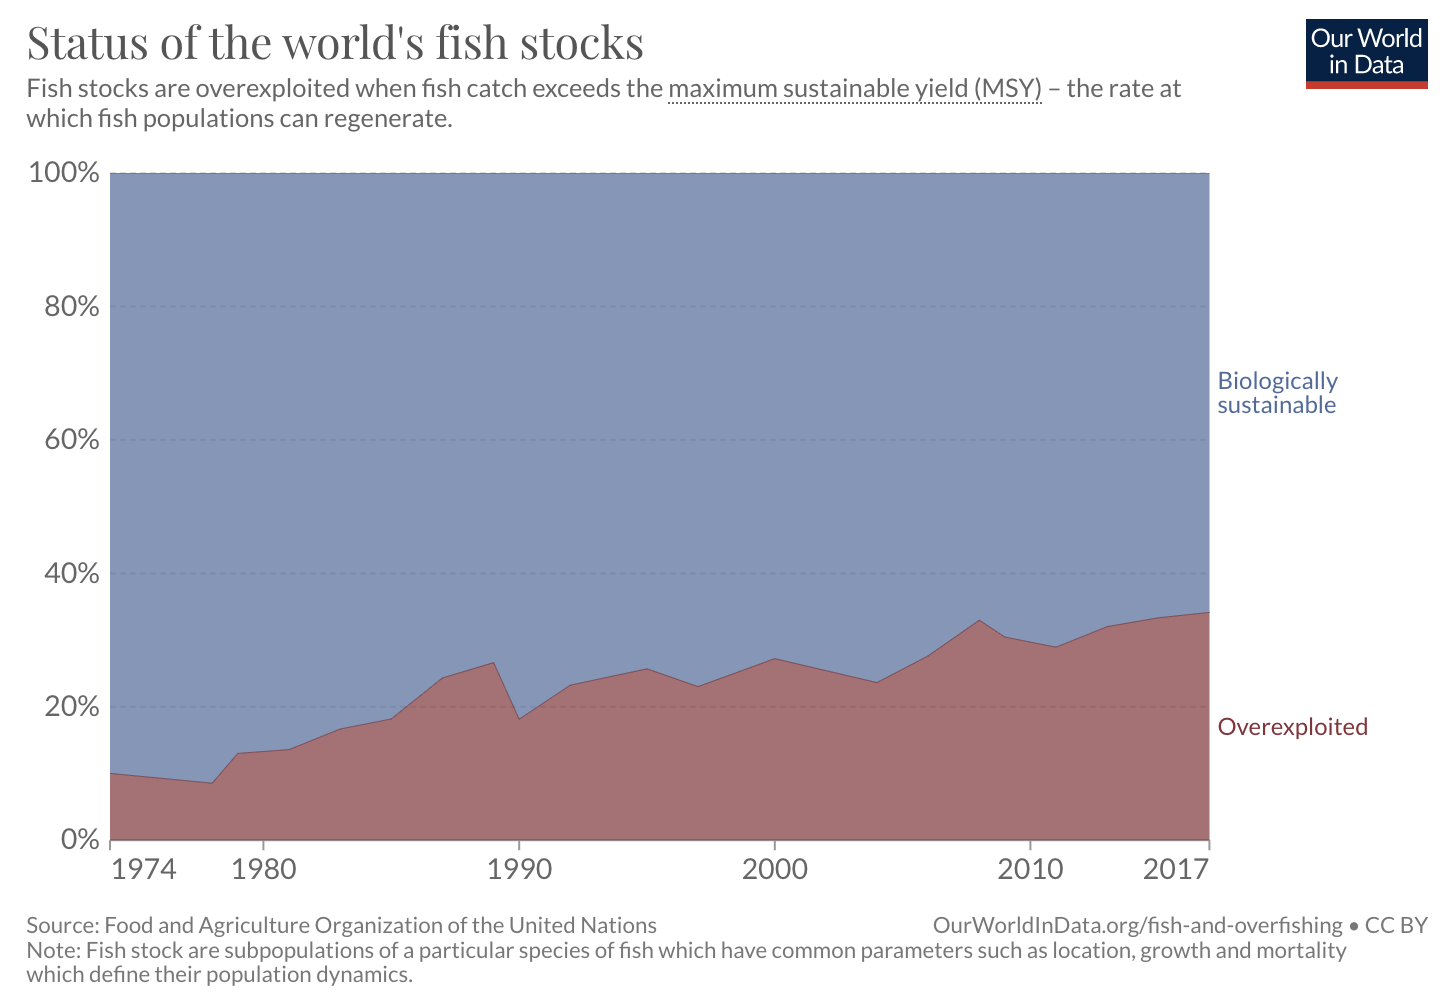
This gives us a static view of world fisheries, but how has this changed over time? Are things getting worse?
The graph below shows the state of the world’s fish stocks from 1974 to 2017. The proportion of overexploited stocks has increased over the past half-century. In 1974 only 10% was overexploited. While exploitation rates varied from year to year, they generally increased during the 1980s, 1990s, and early 2000s. In 2008, this reached 32%. Over the last decade, there has been some variability, but overfishing has hovered around a third globally. Some regions are fishing much more sustainably than others.
Source:
Ritchie H. & Roser M. (2021, Octubre) Fishing and Overfishing, Our world Data (first published). URL: https://ourworldindata.org/fish-and-overfishing#total-seafood-production-by-country
With regards from the authors to Ray Hilborn, Michael Melnychuk, Max Mossler y Daniel Hively de RAM Legacy Stock Assessment Database for the provision of the data and the feedback about the project.