We share the article on How much fish and seafood do people eat? from the fishing and overweight report published by OurWorldData.
Some countries in the world eat close to 100 kilograms of shellfish per person each year. Others average only a few kilograms.
In the graphs shown here, we see the average per capita consumption of fish and seafood around the world.6 The main consumers of seafood are countries such as Iceland, the Maldives and Hong Kong, which consume more than 70 kilograms per person and, in some cases, more than 90 kilograms. . Compare that to those at the bottom of the table: Indians and South Africans consume less than 10 kilograms. Those in Ethiopia and Pakistan eat only a few.
There is a strong relationship between income and overall meat consumption: as we get richer, we tend to eat more meat. This relationship is not as strong for shellfish. Many low-income countries rely on subsistence fishing as a key food source.

Note: Data is based on per capita food supply at the consumer level, but does not account for food waste at the
consumer level.
How much of our protein comes from fish and seafood?
How much of our total protein, of vegetable and animal origin, comes from fish and shellfish? In the graph here, we see protein intake per capita from different sources around the world.
Globally, 7% of total protein intake comes from seafood.7
In some countries it represents a much higher proportion: more than a third in the Maldives; a fifth in Japan, Iceland and Cambodia; and 14% in Hong Kong.

Description: Originally given per-capita, and converted into total figures by multiplying by population (given by FAO). Per-capita values are obtained by dividing the original values by the population (either provided by FAO or by OWID).
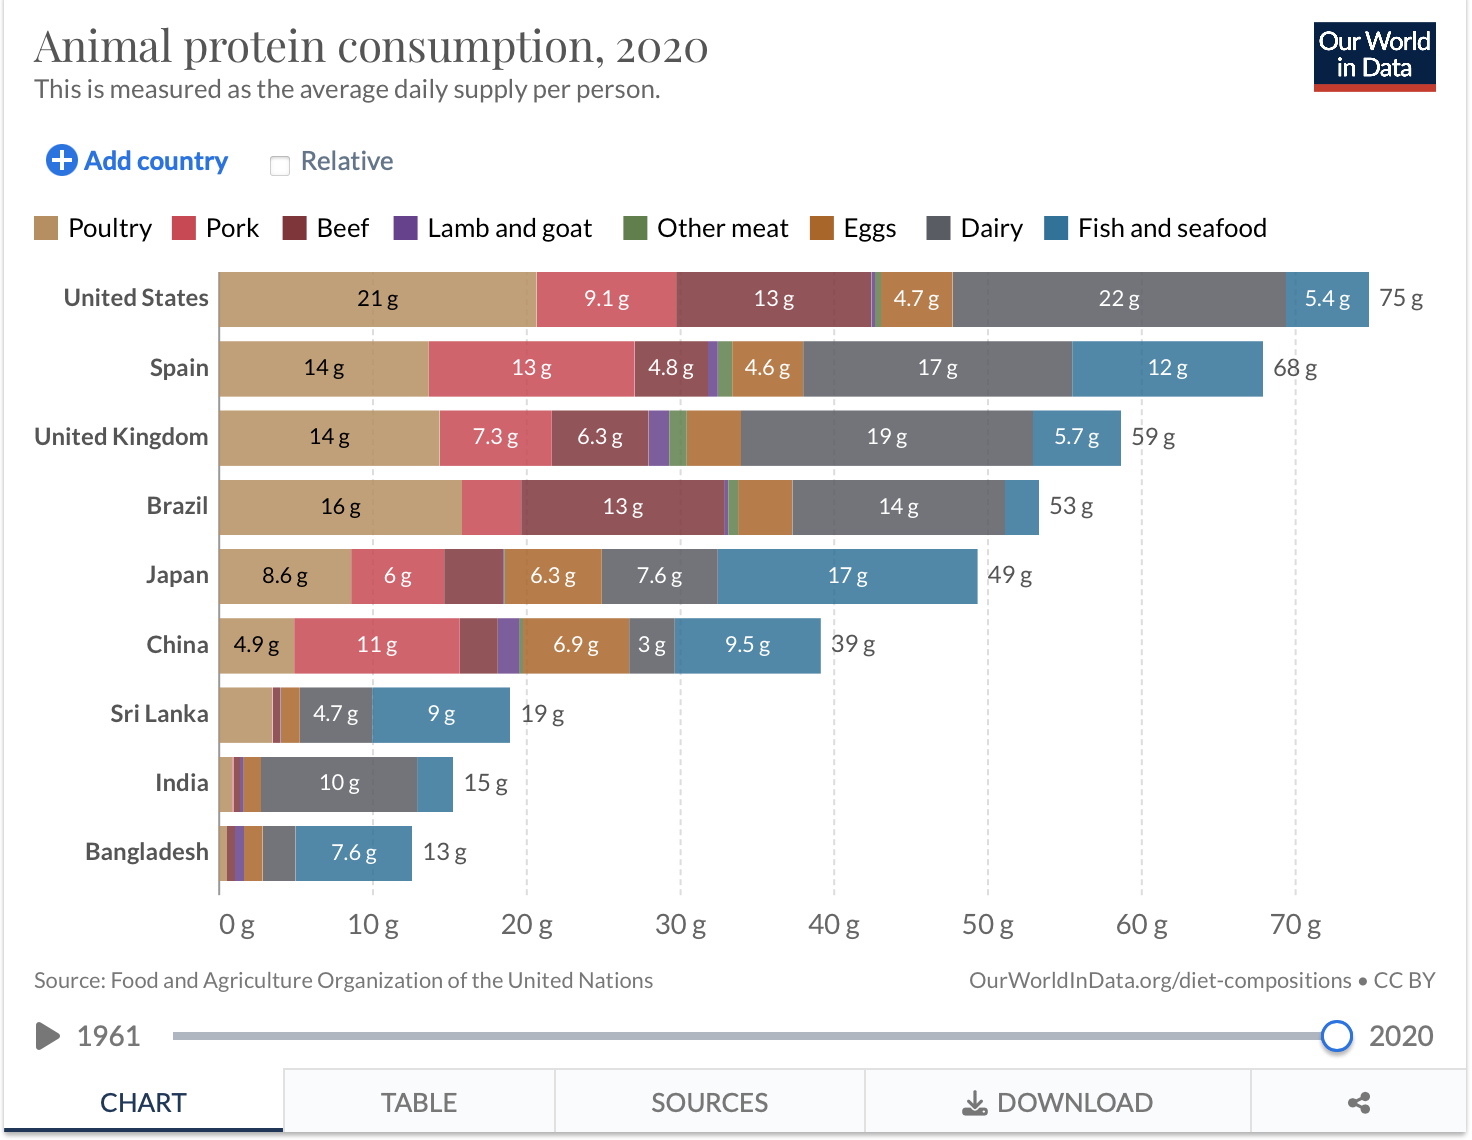
How much of our animal protein comes from fish and seafood?
It is possible to get all the protein we need from plant sources. But to get all the amino acids (the building blocks of protein) from a plant-based diet, you need to have the right variety of foods. It requires a balance of staple foods like grains and more complete proteins like legumes (peas and beans). Unfortunately, many in the poorest countries are heavily dependent on cereals and lack this dietary diversity. In this case, animal sources of protein may be of vital importance for human health.
So how much of our animal protein comes from shellfish? Globally, around 17% of our animal protein comes from seafood.8 In the charts below, we see the breakdown of animal protein consumption by country.
In some countries, shellfish dominate. It represents more than 70% of the animal protein in Cambodia; 60% in Bangladesh and Maldives; and more than half in The Gambia and Sri Lanka.
For billions of people around the world, fish is an important source of nutrition.
Description: Originally given per-capita, and converted into total figures by multiplying by population (given by FAO). Per-capita values are obtained by dividing the original values by the population (either provided by FAO or by OWID).
Source:
Ritchie H. & Roser M. (2021, Octubre) Fishing and Overfishing, Our world in Data (first published). URL: https://ourworldindata.org/fish-and-overfishing#total-seafood-production-by-country
With appreciation to the authors to Ray Hilborn, Michael Melnychuk, Max Mossler, and Daniel Hively of the RAM Legacy Stock Assessment Database for providing the data and comments on the project.